
Melanoma Prediction Kaggle Contest - Part 1: Contest and Exploration
If you would prefer to go straight to the code to learn about my approach to the competition please go here.
The Contest
For the past four years, Kaggle has run a competition in collaboration with the Society for Imaging Informatics in Medicine (SIIM) and the International Skin Imaging Collaboration (ISIC), where contestants must identify skin melanoma from images of skin lesions. Identifying skin cancer melanoma is an important problem as skin cancer is the most prevelant type of cancer and melanoma represent 75% of skin cancer deaths.
Currently, dermatologists evaluate every mole a patient posseses and try to identify those most likely to be melanoma. If identified early, melanoma can be removed using minor surgery and most are cured. Clearly, if a model can be trained to aid health professionals in identification of melanoma so that more can be caught early, then lives can be saved.
The Data
The data for this competition consists of images of skin lesions with matching patient information (metadata). The original images are provided in DICOM format (contains image and metadata), as well as jpegs (these were used). The full dataset is over 100GBs (over 40,000 images) which immediately provides a problem with regards to storage and retrieval. Also, training a model with such large amounts of data will take a long time. At the beginning of this contest I downloaded the full dataset to a cloud machine and resized images myself. This both took a long amount of time to do and cost a lot for storage. Fortunately, as the competition progressed other competitors provided public Kaggle datasets of resized images so storage and retrieval was taken care of by Kaggle.
The metadata for this contest consists of:
- Image file name
- Patient ID
- Sex
- Approximate age (nearest 5 years)
- Anatomical site of lesion (6 categories)
- Diagnosis (nevus, seborrheic keratosis, melona etc but mostly “Unknown”)
- Benign or malignant (the target variable)
However, an important additional pair of variables was identified early on as the width and height of the original full-size image. It seems when the images were taken, different devices used produced different sized images and this gave more information on the likelihood of a benign/malignant lesion. One could imagine if a patient has a lesion which is identified by the dermatologist as being very likely malignant, the patient is immediately referred high up the chain of specialists who may have higher resolution cameras.
As well as the competition data, contestants were allowed to use external data so long as it is publically available and all contestants were notified in a thread of its existence.
As this is the fourth instance of the contest, there were three years of external data available to possibly use. Last years contest data (2019) contained all the images from the 2018 and 2017 editions so the 2019 data was used. Other contestants provided addtional external data but I did not try using it.
Model Evaluation
Due to the significant imbalance in the target variable, the contest does not use accuracy for evaluation of performance. If accuracy were used a simple prediction of always “benign” would achieve a score of \(98\%+\). Rather, the area under the receiver operating characteristic curve is used. That is quite the mouth-full so AUC-ROC is the shortened version.
Firstly, the ROC curve has false positive rate on the \(x\)-axis and true positive rate on the \(y\)-axis. The curve is given by varying the threshold to determine whether a prediction is negative or positive. For each test case the model to be evaluated will produce a value between \(0\) and \(1\) representing the probability of a test case being positive (malignant). The threshold determines for what probabilities we consider this to be a positive or negative prediction. Of course, often a threshold of \(0.5\) will be chosen but \(0.5\) does not have to be used.
A perfect classifier’s ROC curve would be right angled, going from the origin to the top-left corner of the plot and then horizontally across to the top-right corner. This is because a perfect classifier would have probability \(0\) for all negative cases and probability 1 for all positives. This would give a false positive rate of \(0\) and true positive rate of \(1\) for all thresholds and this curve would have an area of \(1\) under it. Any non-perfect classifier will have an ROC curve with area less than below.
In this contest, the top submissions on the public leaderboard have AUC-ROC \(> 0.97\), so accurate predicitons are at least possible. Though many of these submissions will be overfitting the test set. Kaggle does not assess predicitons on the full test set and once the competition is over, will assess contestants chosen 3 submissions on the full test set, so those overfit on the assessed test data should fall on the leaderboard.
Exploration
Please see this notebook for the full exploration. Limited results will be presented here.
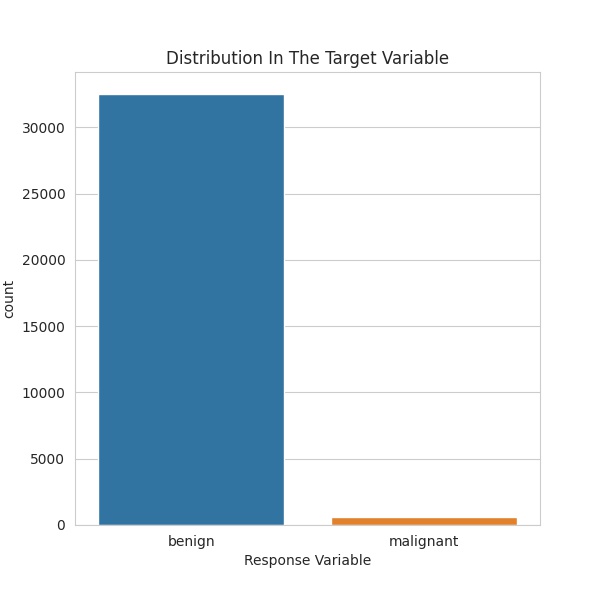
The most important factor to note of the data in this competition is the extreme imbalance in the target variable. As can be seen below, there are far more benign data entries, compared to malignant. In fact, only \(1.76\%\) of the data is malignant. This is of course good in reality, as a low number of people suspected of skin cancer are malignant but it complicates training.
Another interesting imbalance in the distribution of variables is that there are more males in both the training and test data. Furthermore, they make up a higher proportion of the malignant data. In the training set \(51.56\%\) of the data is male, whereas of the malignant cases, \(62.33\%\) are male. After some research it seems that skin cancer melanoma are more common amongst males, at least in the United States. If we look at males as a whole, \(2.13\%\) of them are malignant, whereas for females, the proportion malignant is \(1.38\%\).
Additionally, there is a higher proportion of males in the testing data than there is in the training. In the training data \(51.56\%\) patients are male, however, in the testing data \(56.96\%\) patients are male. If we accept that males are more likely to be malignant, then there should be a higher proportion of malignant patients in the test set than the training set. If this is the case then a model will need to associate a patient being male with an increased chance of being malignant.
Now let’s switch out attention to the distribution of ages of patients across the sexes.
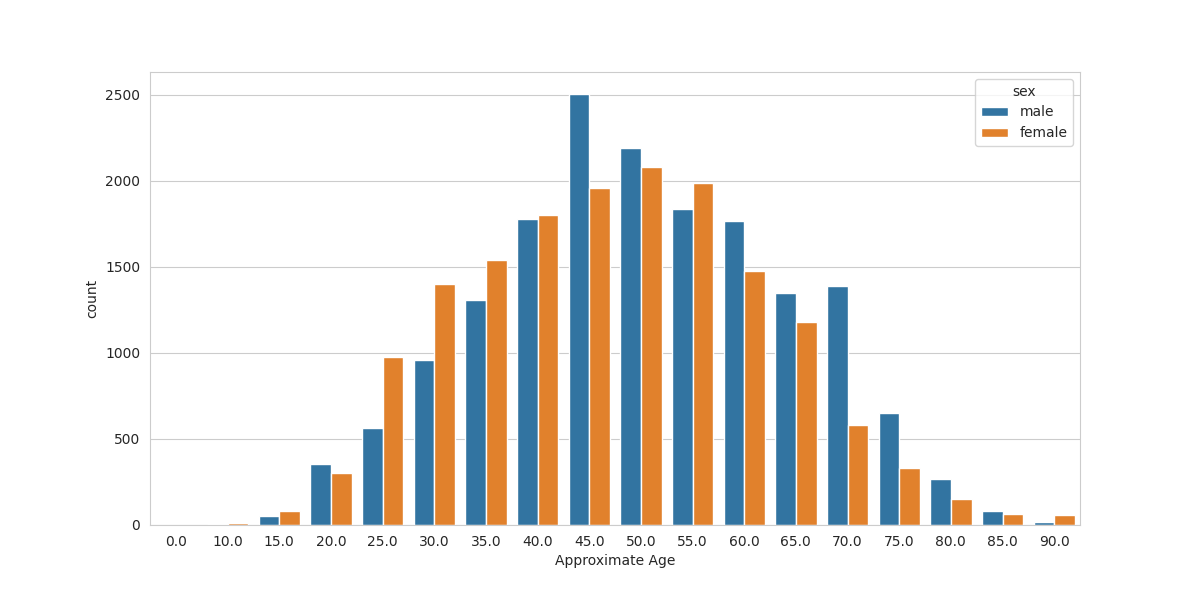
We see a trend that for the ages of 25 to 40, there are more females in the dataset and for older patients there are more males (exceptions: 55, 90). Possibly there are more females in the younger ages because they are seeing a gynacologist (who may notice lesions) and males are seeing no doctor in that period? There is a huge jump in males at the 45 year mark. Maybe this is when men have their first physical exam and their doctor notices moles that should be checked? I am not an expert on health, especially in the US.
A very important thing to note in the data is that patients appear more than once in the dataset. This is important because when we split the training data into a train/validation split we should try to keep patients either in one or the other. This prevents leakage and would artifially inflate the validation performance by allowing the model to be trained on a patient who is also used for assessment in the validation set.
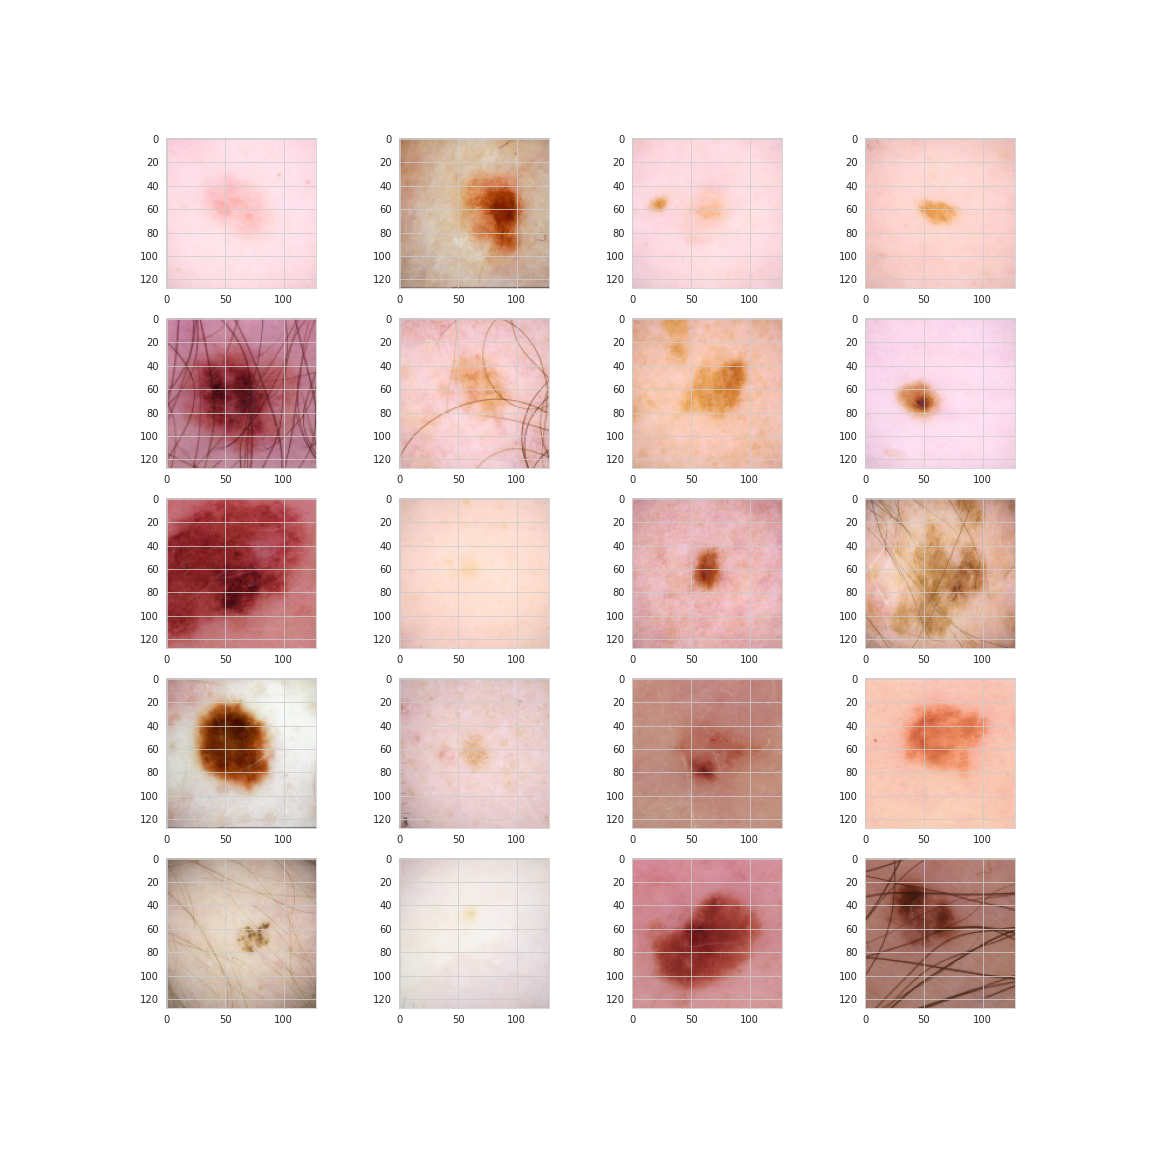
Finally, let’s take a look at some sample images of the lesions. Here are 20 random images of benign lesions.
And now here are 20 malignant.
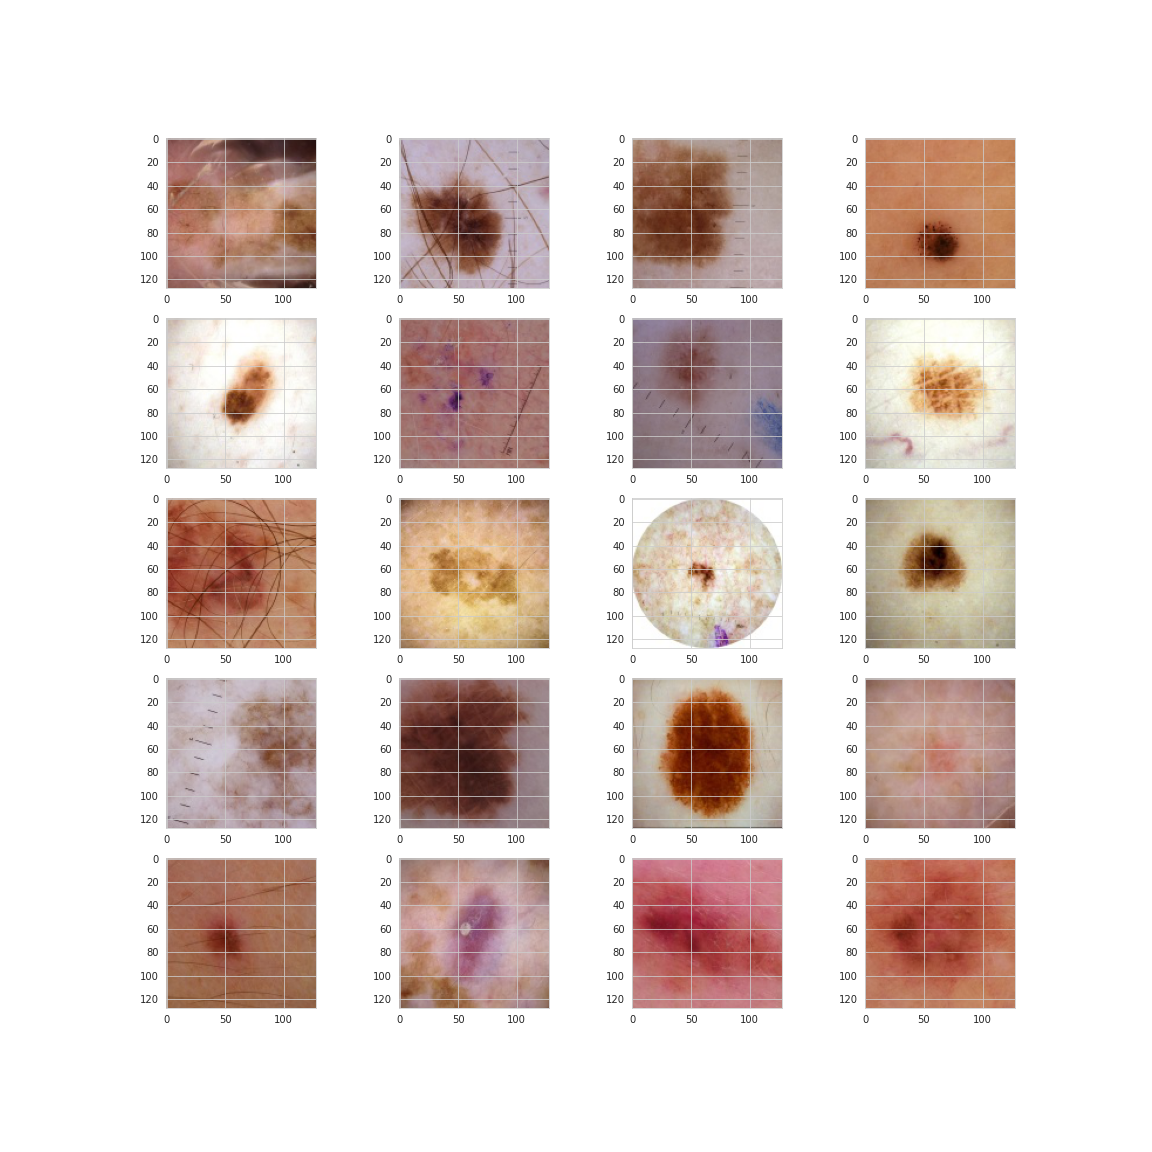
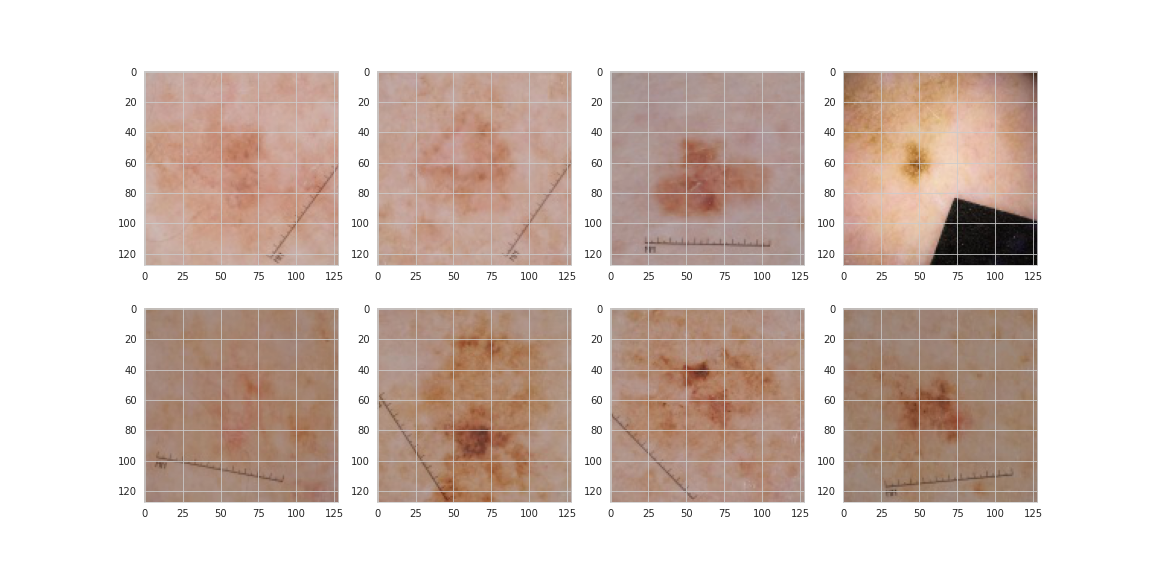
From this small sample it would seem malignant lesions may be darker and have more abnormal shaping and texture. Sources online indicate this something that dermatologists look for, however, the images below which are all malignant from the same patient show that darkness and irregularity are not necessarily the be-all and end-all.
Conclusions of the Exploration
- The malignant class makes up only \(1.76\%\) of the data
- There are more males than females in both training and testing data. The proportion of males is higher in the test data. This is important because:
- Males make up more of the malignant data points and seem to suffer from skin cancer melanoma more often in the population
- Age is distributed fairly normally with a mean around 49 and standard deviation of 14
- There is missing data in the sex, age_approx and anatom_site_general_challenge columns though they are few in number
- Images of patients contain haris, black spots, are sometimes circular, are possibility highlighted with pen or ink and contain MM rulers. In other words, they are messy!
- There are multiple images of the same patients in the training data

Comments